While Bill James was writing his Abstracts in the 1980’s, he came up with Similarity Scores, which puts a number on how similar the statistics are from two different players. Scores can range from 1000 for the most identical players to 0 for the most dissimilar. Consider that two players that are very much alike in Andre Thornton and John Mayberry Sr, who have a similarity score of 974 while Neifi Perez and Babe Ruth have a similarity score of 0.
I decided to take this concept and apply it to the winning percentages of teams in a single season and compare it to teams in other seasons. The method is very simple:
Find the difference between each team’s winning percentage from the two seasons being compared. For example, the New York Yankees in 2015 had a winning percentage of .537 while the Yankees of 1927 had a winning percentage of .714. The difference is .177 (.714-.537). Do this for all teams and find the average. Then multiply that average by 1000 and subtract it from 1000. Two identical seasons would have a score of 1000.
When comparing years with expansion teams (1961-present) to years before expansion (1901-1960), I only included teams that were active during the two seasons. So when comparing 2015 to 1915, only 16 teams will be included in the comparison since 14 teams were not active in 1915.
I was most curious to see which season is the most similar to 2015. Surprisingly (I guess any season before 2010 would surprise me), the most similar season to 2015 is 1945, which had a similarity score of 966. In fact, this is the second closest match (highest score) between two seasons in the entire history of baseball.
2015 vs 1945 (Similarity Score: 966):

Of course, when comparing 2015 to 1945, we are only considering the winning percentages of 16 of the 30 teams. So if we limit our search to the 30-team era (1998-2015), we’ll find that the most similar season to 2015 is …… 2014. Kind of boring, I know. But it’s natural that the most similar seasons are sequential since that is when team’s will have the most similar personnel.
2015 vs 2014 (Similarity Score: 937):

Now what if we want to see which season is most dissimilar to 2015 during the 30-team era? That would go to the 2002 season.
2015 vs 2002 (Similarity Score: 908):

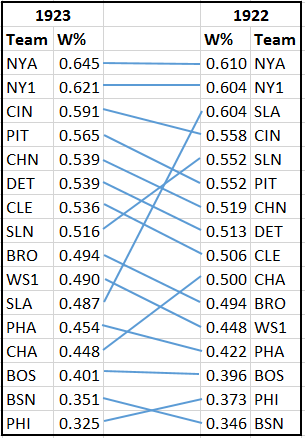
Which two seasons in history have the most similar winning percentages? The 1922 and 1923 seasons. Again, back-to-back seasons are more likely to have higher scores because their team’s have changed the least.
1923 vs 1922 (Similarity Score: 968):
Next, these two seasons have the most dissimilar winning percentages:
1953 vs 1909 (Similarity Score: 819):

Finally, I’ve included a list of the top and bottom 15 similarity scores of all-time:
| Highest Scores | Lowest Scores | |||||
|---|---|---|---|---|---|---|
| Years | Score | Teams | Years | Score | Teams | |
| 1923 vs 1922 | 968 | 16 | 1953 vs 1909 | 819 | 16 | |
| 2015 vs 1945 | 966 | 16 | 1954 vs 1909 | 831 | 16 | |
| 1973 vs 1971 | 963 | 24 | 1961 vs 1912 | 836 | 16 | |
| 1957 vs 1956 | 963 | 16 | 1915 vs 1906 | 836 | 16 | |
| 1959 vs 1958 | 962 | 16 | 1946 vs 1906 | 839 | 16 | |
| 1973 vs 1972 | 962 | 24 | 1943 vs 1909 | 839 | 16 | |
| 1997 vs 1959 | 961 | 16 | 2002 vs 1908 | 840 | 16 | |
| 1964 vs 1963 | 961 | 20 | 1956 vs 1912 | 840 | 16 | |
| 1911 vs 1910 | 961 | 16 | 1942 vs 1907 | 840 | 16 | |
| 1931 vs 1930 | 960 | 16 | 1953 vs 1912 | 842 | 16 | |
| 1997 vs 1958 | 959 | 16 | 1942 vs 1913 | 842 | 16 | |
| 1942 vs 1941 | 959 | 16 | 1942 vs 1909 | 842 | 16 | |
| 1937 vs 1936 | 959 | 16 | 1957 vs 1912 | 843 | 16 | |
| 1966 vs 1965 | 959 | 20 | 1928 vs 1915 | 843 | 16 | |
| 1999 vs 1958 | 958 | 16 | 1921 vs 1909 | 843 | 16 | |
Very cool!
Would also be interesting to see a list of the most similar teams based on the number of games above/below .500 at each point of the season. The Blue Jays had a few long winning streaks this year and were also very strong in the second half. Who had the most comparable season in history? The similarity score between the Jays and “Team X” would be calculated like this:
$sim=1,000
for each game in Jays schedule {
$sim = $sim – abs(Jays vs .500 – Team X vs .500)
}
The most similar teams would make a nice-looking graph.
That’s a great idea. I’ll see what I can come up with.